Broadway Box Office Analysis- June 2025 + Which Shows Saw a Post-Tonys Bump
Check out an in-depth Broadway grosses report for June 2025.
It was another very strong month for Broadway, with three of the four weeks exceeding $40 million in total gross. This has been the strongest start to the Broadway season gross wise through the first four weeks. However, that pattern is unlikely to continue as many limited runs came to an end this month, as well as shows closing earlier than expected due to low sale. Some of these closing notices can feel shocking, but it is pretty typical. Most years at least one or two shows close after the Tony Awards, in conjunction with limited runs nearing their end. Though the recent slew of closing is unfortunate for all those employed, in an era of shaky investor confidence, keeping shows running that are losing well over $100k a week is not going to boost confidence. This month includes the Juneteenth Federal Holiday, as well as the Tony Awards, traditionally the time of highest visibility for the industry as a whole.
As in previous months, this list uses Theoretical Average Monthly Gross as the primary metric; a figure calculated by using the average attendance, capacity and average ticket price industry-wide for the month, multiplied by the number of performances played and the size of the theater. This combined with looking at a show's total gross and gross per performance allows for analysis on a rate basis, rather than strictly a cumulative basis, normalizing weeks where there may be partial performance weeks or extra performances.
June Average Ticket Price: $132.58; June Average Capacity: 89.77%
Shows are ordered from largest percentage difference to theoretical average to smallest in their respective categories (split into shows from this year and long runners).
24-25 (+25/26) Season
1. Othello- Theoretical Average Monthly Gross: $1,986,208; June Total Gross: $7,358,132; Percent Difference: +270%; Gross Per Performance: $459,883; May Rank: #1
Othello's final two weeks set even more average ticket price records, as they have been doing for their entire run.
2. Good Night and Good Luck- Theoretical Average Monthly Gross: $2,942,177; June Total Gross: $8,576,825; Percent Difference: +192%; Gross Per Performance: $536,052; May Rank: #2
Good Night and Good Luck in the final two weeks of performances had the third highest total gross of the month, just behind Glengarry Glen Ross and Wicked. Simply astonishing numbers.
3. Just In Time- Theoretical Average Monthly Gross: $2,627,964; June Total Gross: $5,022,890; Percent Difference +91%; Gross Per Performance: $156,965; May Rank: #4
Just In Time splish splashes past Glengarry Glen Ross to become the first show to break into the top three (and ostensibly will be number one in the next iteration). In spite of a quiet night at the Tony Awards, they had one of the more viewed Tony performances, which may be contributing to their success.
4. Glengarry Glen Ross- Theoretical Average Monthly Gross: $5,121,606, June Total Gross: $9,928,950; Percent Difference: +84%; Gross Per Performance: $285,573; May Rank: #3
Glengarry Glen Ross drops one place in our rankings, with their average gross per performance dropping ~15k. However, with the closing of Good Night and Good Luck as well as Othello, Glengarry comes in as the highest grossing show of the month.
5. The Picture of Dorian Gray- Theoretical Average Monthly Gross: $3,434,326; JuneTotal Gross: $6,007,948; Percent Difference: +75%; Gross Per Performance: $207,171; May Rank #5
The best reviewed star-led play of the season picked up a pair of Tony- the only celebrity-driven play to receive any- including Best Leading Actress for Sarah Snook. They played their final performance on Sunday, and their gross performance
7. Oh, Mary!- Theoretical Average Monthly Gross: $3,995,267; June Total Gross: $5,037,776; Percent Difference: +48%; Gross Per Performance: $157,431; May Rank: #7
Cole Escola’s Pulitzer finalist show picked up a pair of Tony Awards, one for Cole themself, and one for Best Direction. Titus Burgess is now reprising their performance as gay nightmare Mary Todd Lincoln, although that is not reflected in these grosses, with Jinkx Monsoon scheduled to take over the role in August.
9. Maybe Happy Ending- Theoretical Average Monthly Gross: $3,705,810; June Total Gross: $4,781,633; Percent Difference: +29%; Gross Per Performance: $149,426; May Rank: #12
Maybe Happy Ending enters the top ten following a big night at the Tony Awards, picking up six awards including the coveted Best Musical. They will be one to watch in the fall after the departure of Tony-winner Darren Criss, but certainly for the next two months they will have bumper grosses.
12. Buena Vista Social Club- Theoretical Average Monthly Gross: $3,995,267; June Total Gross: $4,974,637; Percent Difference: +25%; Gross Per Performance: $155,457; May Rank: #11
Buena Vista Social Club was the other major winner amongst the musicals during the Tony Awrads, picking up 4 competitive awards as well as one special award. Their grosses have been amazing so far, and there’s no reason to think that trend won’t continue for at least the time being.
13. Purpose- Theoretical Average Monthly Gross: $2,212,822; June Total Gross: $3,148,147; Percent Difference: +11%; Gross Per Performance: $76,752; May Rank #16
Purpose picked up Best Play at the Tony Awards, as well as the Pulitzer Prize for Drama earlier this year. They have been having great success over the last month, and that is set to continue for the remainder of their run.
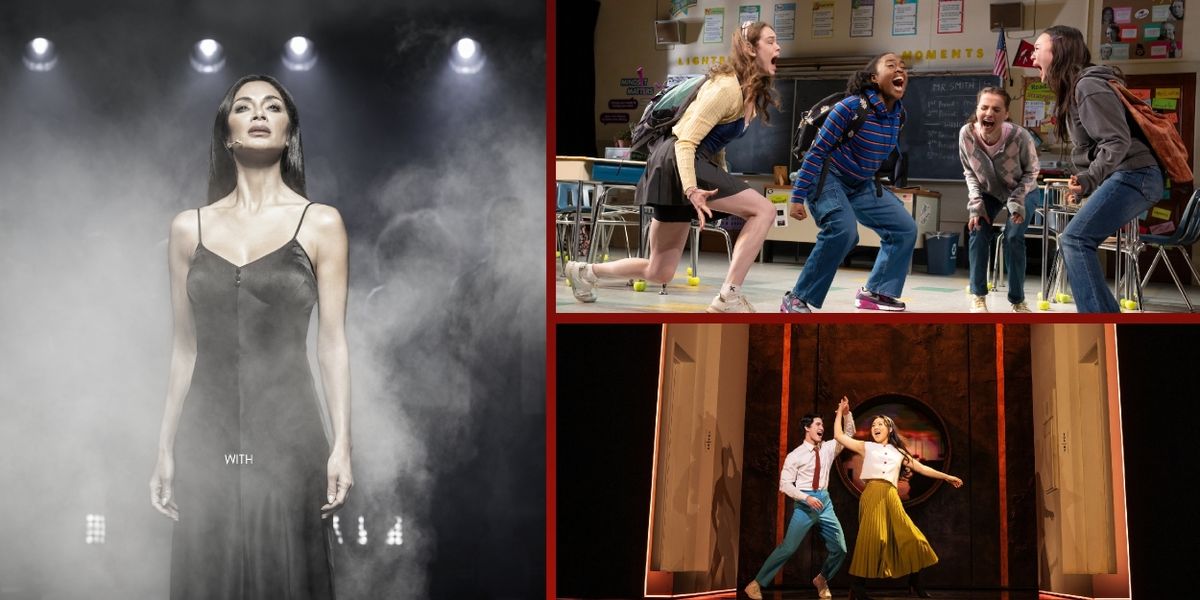
14. John Proctor is the Villain- Theoretical Average Monthly Gross: $2,940,273; June Total Gross: $3,148,147; Percent Difference: 7%; Gross Per Performance: $98,380; May Rank: #21
In spite of failing to win any hardware at the Tony Awards, John Proctor is the Villain has been having fantastic grosses- including two weeks of the highest grosses at the Booth Theatre since December 2019 with Freestyle Love Supreme. Stranger Things star Sadie Sink departs the cast on July 13, with the show slated to continue performances through August 31. They are the new show this year with the most followers on TikTok, no small feat given the virality of shows like Death Becomes Her and Maybe Happy Ending.
15. Operation Mincemeat- Theoretical Average Monthly Gross: $3,008,829; June Total Gross: $3,088,595; Percent Difference: +3%; Gross Per Performance: $96,519; May Rank: #14
Operation Mincemeat slipped another place in our rankings, though they continue to hold a very strong position. Jak Malone’s Tony Award for Best Featured Actor in a Musical may help them in the coming months as well.
16. Death Becomes Her- Theoretical Average Monthly Gross: $5,501,229; June Total Gross $5,481,370; Percent Difference: 0%; Gross Per Performance: $176,818; May Rank: #18
The fifth and final new musical on this list that is likely to be turning a profit week to week (which is a major accomplishment industry wide), Death Becomes Her continues to do very very well. This is in spite of the prolonged absense of Tony nominee Megan Hilty, who is recovering from a vocal injury.
17. Sunset Boulevard- Theoretical Average Monthly Gross: $6,197,140; June Total Gross: $6,007,520; Percent Difference: -3%; Gross Per Performance: $187,735; May Rank #26
Sunset Boulevard picked up a couple of Tony Awards, including Best Revival of a Musical, which they were the heavy favorite for heading into the ceremony. They close July 20, and will be putting up sky high grosses until then, most likely the best of their run.
24. Sondheim’s Old Friends- Theoretical Average Monthly Gross: $2,448,958; June Total Gross: $1,862,725; Percent Difference: -24%; Gross Per Performance: $58,210; May Rank: #13
One of the furthest falling shows this month compared to last, Old Friends did not have as strong grosses at the start of the month, and then their extension period was marred by Bernadette Peters being out for some performances. Expect their final week to have higher grosses.
27. Gypsy- Theoretical Average Monthly Gross: $6,055,978; June Total Gross: $4,504,780; Percent Difference: -26%; Gross Per Performance: $140,774; May Rank: #24
Audra McDonald did not come home with the Tony Award for Best Actress in a Musical. However, her performance of "Rose's Turn" is one of the most widely viewed performances of the night, which may bode well for the show moving forward. A similar thing happened two years ago with Sweeney Todd, a widely watched Tony Awards performance helped augment the lack of major awards. One to watch moving forward.
28. Pirates! The Penzance Musical- Theoretical Average Monthly Gross: $2,768,884; June Total Gross: $1,967,695; Percent Difference: -29%; Gross Per Performance: $61,490; May Rank: #27
Pirates clocked in with a good month, increasing their grosses every week. We are entering their extension period heading into closing on July 27- it will be interesting to see how their gross fare heading into close.
32. Stranger Things The First Shadow- Theoretical Average Monthly Gross: $6,070,978; June Total Gross: $3,945,067; Percent Difference: -35%; Gross Per Performance: $123,283; May Rank: #35
Stranger Things picked up more Tony Awards than any other play this year. Season 5 of the TV show releases in December, and as the promotion for that ramps up, I expect Stranger Things’s grosses to respond in kind. In the meanwhile, they are in a good not great spot.
33. Call Me, Izzy- Theoretical Average Monthly Gross: $3,119,279; June Total Gross: $1,953,279; Percent Difference: -37%; Gross Per Performance: $69,759; May Rank: #17
Call Me, Izzy is the furthest falling show, not entirely surprising given the typically inflated grosses that come with the first preview performances. Luckily, it is conceivable that the show could be making money, since the show is a solo performance.
34. Floyd Collins- Theoretical Average Monthly Gross: $4,025,736; June Total Gross: $2,328,200; Percent Difference: -42%; Gross Per Performance: $72,756; May Rank: #39
Floyd Collins had a better month (or really a better final week) heading into their closing. This show did not catch on nearly as much as other revivals recently at the Lincoln Center have. Hopefully Ragtime can reverse that fortune this fall.
35. Smash- Theoretical Average Monthly Gross: $5,206,059; June Total Gross $2,835,681; Percent Difference: -46%; Gross Per Performance: $91,474; May Rank: #32
Smash announced their closing right after the Tony awards, which was sad but unsurprising. The last show in the Imperial, Water for Elephants, reportedly needed about $950,000 a week to make money according to the Broadway Journal. Smash, which had a similar sized cast and a larger orchestra, struggled to beat that mark, making it unlikely they were making money, particularly in weeks where they failed to clear $700,000 in sales. The next tenant for their theatre has already been announced, Tim Rice and ABBA’s Chess musical, starring Aaron Tveit and Lea Michele, which will begin performances this October.
37. The Last Five Years- Theoretical Average Monthly Gross: $3,801,979, June Total Gross: $1,990,250; Percent Difference: -48%; Gross Per Performance: $60,311; May Rank: #33
The Last Five Years limped into their closing, with a pretty poor box office performance for a star-led revival. They did complete their limited run, which did not always feel like a sure thing given how low some of their grosses were.
38. Boop! The Musical- Theoretical Average Monthly Gross: $4,330,428; June Total Gross $2,161,173; Percent Difference: -53%; Gross Per Performance: $63,352; May Rank #40
Boop! announced their closure this past week for July 13. As stated last month, this show has not had a week where they have lost less than $200k (according to the Broadway Journal). Hopefully the cast can play to fuller houses towards the end of the run.
39. Dead Outlaw- Theoretical Average Monthly Gross: $3,991,459; June Total Gross: $1,894,085; Percent Difference: -53%; Gross Per Performance: $59,190; May Rank: #38
Dead Outlaw closed this past Sunday after not picking up any Tony Awards. Last year’s Drama Desk and Outer Critics Circle Best Musical winner, they were never really able to find their footing on Broadway. They will be releasing a full audio recording of the show (recorded during the off-Broadway run) this October on Audible.
40. Real Women Have Curves- Theoretical Average Monthly Gross: $4,018,119; June Total Gross: $1,680,227; Percent Difference: -58%; Gross Per Performance: $52,507; May Rank: #41
At the bottom of our list comes Real Women Have Curves. They closed on Sunday, similarly for fairly obvious reasons. They were unable to establish themselves commercially, in spite of being a timely subject matter.
Long-Runners
6. Hamilton- Theoretical Average Monthly Gross: $5,042,644, JuneTotal Gross: $8,144,906; Percent Difference: +62%; Gross Per Performance: $254,528; May Rank: #6
Hamilton had a fantastic month, even by their standards. Their 10th Anniversary performance on the Tony Awards was the most watched performance of the night, and that will likely have a positive impact on their grosses, as will the upcoming stint of Leslie Odom Jr. as Aaron Burr.
8. Wicked- Theoretical Average Monthly Gross: $7,335,448; June Total Gross: $9,542,313; Percent Difference: +30%; Gross Per Performance: $298,197; May Rank: #8
Wicked’s signs of slightly slowing down continued this month, although their grosses were still higher than this time last year. It could be a sign of decreasing international tourism if their summer is relatively weaker than the rest of the year. Hamilton, Wicked and Aladdin are the only long running shows to significantly increase their grosses month to month, comparing June 2024 to 2025.
10. The Outsiders- Theoretical Average Monthly Gross: $3,900,051, June Total Gross: $5,019,463; Percent Difference: +29%; Gross Per Performance: $156,858; May Rank: #9
The Outsiders continues to slow down a little bit as the hype of last year's Best Musical Tony win dies down a little. But they are still in a strong position of course, and it stands to reason that they will likely announce their recoupment in the next couple of months.
11. The Lion King- Theoretical Average Monthly Gross: $6,459,460; June Total Gross: $8,240,097; Percent Difference: +28%; Gross Per Performance: $257,503; May Rank: #10
It was a tougher month of June for the Lion King, although they continue to be one of the top grossers on Broadway. Even though they were over $2 million in gross every week, it is about a ~5% decrease in grosses from last year. A pattern that, if it were to hold, would be one of the more definitive signs of weaker international tourism.
18. MJ: The Musical- Theoretical Average Monthly Gross: $5,282,589; June Total Gross: $4,870,764; Percent Difference: -8%; Gross Per Performance: $152,211; May Rank: #19
MJ held in a similar place as they did in May, but decreased year to year. They continue to gross about 11% lower on average than last year.
19. &Juliet- Theoretical Average Monthly Gross: $3,907,669; June Total Gross: $3,511,633; Percent Difference: -10%; Gross Per Performance: $109,739; May Rank: #20
&Juliet mostly held station month to month, and even managed to gross slightly better than June 2024. They at this point have settled into their role as a long running show, and with a Toronto production coming soon and a North American Tour underway, they are in a fine place.
20. Hadestown- Theoretical Average Monthly Gross: $3,496,335; June Total Gross: $3,028,530; Percent Difference: -13%; Gross Per Performance: $94,642; May Rank: #25
Hadestown was one of the highest rising long runnings shows, recovering well from an unusually tough May. Hopefully as the summer continues they will sustain this relative success.
21. Aladdin- Theoretical Average Monthly Gross: $6,577,528; June Total Gross $5,579,420; Percent Difference: -15%; Gross Per Performance: $174,357; May Rank: #28
Aladdin was the highest rising long running show this past month, continuing their strong year.
22. The Book of Mormon- Theoretical Average Monthly Gross: $4,060,014; June Total Gross: $3,333,800; Percent Difference: -18%; Gross Per Performance: $104,181; May Rank: #23
It was another tough month for the Book of Mormon, although they just recently rolled out a new ad campaign in New York City and on social media. Hopefully that can change their fortunes some.
23. Cabaret- Theoretical Average Monthly Gross: $4,075,249; June Total Gross: $3,107,497; Percent Difference: -24% Gross Per Performance: $97,109; May Rank: #22
Cabaret announced this month that Tony Award winner Billy Porter and Olivier Award Nominee Marisha Wallace will take over the role of Emcee and Sally Bowles from Orville Peck and Eva Noblezada, reprising their West End roles. They also announced that they will be the final duo to take over the role. It’s not entirely surprising, each of two replacement casts have sold fewer tickets than the previous, and June 2025 was the weakest month to date for Cabaret. Hopefully they can have a bumper final couple of months into their closing this October.
25. The Great Gatsby- Theoretical Average Monthly Gross: $5,655,836, June Total Gross: $4,294,986; Percent Difference: -24%; Gross Per Performance: $134,218; May Rank: #30
Gatsby had a much more positive month than last, showing good grosses as they enter their second summer of performances. Their placement on this list is a function more of house size, rather than poor performance.
26. Moulin Rouge!- Theoretical Average Monthly Gross: $4,951,237; June Total Gross: $3,725,845; Percent Difference: -25%; Gross Per Performance: $116,433; May Rank: #15
Boy George departed the show, and so did the stronger grosses of Moulin Rouge that they had been showing of late. They have another cast coming soon, but they are a very expensive to run, spectacle driven show. Cabaret has often been higher on these lists and they just announced closing.
29. Six- Theoretical Average Monthly Gross: $3,926,712; June Total Gross: $2,755,320; Percent Difference: -30%; Gross Per Performance: $86,104; May Rank: #31
The last two months has been the worst 8 week stretch of Six on broadway. This month was marginally better than last, and they ended on a high with the holiday week, but the next few months are critical for the show to start showing some signs of life. They are likely very inexpensive to operate, but how long can they be near the bottom of the gross charts before something has to change?
30. Hell’s Kitchen- Theoretical Average Monthly Gross: $5,549,194; June Total Gross: $3,776,553; Percent Difference: -32%; Gross Per Performance: $118,017; May Rank: #29
Hell’s Kitchen is the lowest musical on our list that is not either closing or Chicago- which is not a place they want to be. Luckily they have been putting up relatively strong grosses still, in the neighborhood of $900k-$1 million every week, so they are still in a strong enough position.
31. Harry Potter and the Cursed Child- Theoretical Average Monthly Gross: $6,177,620; June Total Gross: $4,121,861; Percent Difference: -33%; Gross Per Performance: $128,808; May Rank: #37
Cursed Child again is near the bottom of our list, although they do have the upcoming stint of Tom Felton reprising his role from the films as Draco Malfoy. Their weaker year continues, hovering around 13% lower than last year.
36. Chicago- Theoretical Average Monthly Gross: $4,113,335; June Total Gross: $2,186,758; Percent Difference: -47%; Gross Per Performance: $68,336; May Rank: #36
Chicago’s grosses slipped from last month, and it slipped compared to this month last year, although by less than other months this year. They have yet to have a celebrity stunt cast this year that has been able to match the box office success of Ariana Madix from last year.
Show Ranking
- Othello (-)
- Good Night and Good Luck (-)
- Just In Time (+1)
- Glengarry Glen Ross (-1)
- The Picture of Dorian Gray (-)
- Hamilton (-)
- Oh, Mary! (-)
- Wicked (-)
- Maybe Happy Ending (+3)
- The Outsiders (-1)
- The Lion King (-1)
- Buena Vista Social Club (-1)
- Purpose (+3)
- John Proctor is the Villain (+7)
- Operation Mincemeat (-1)
- Death Becomes Her (+2)
- Sunset Boulevard (+9)
- MJ: The Musical (+1)
- &Juliet (+1)
- Hadestown (+5)
- Aladdin (+7)
- The Book of Mormon (+1)
- Cabaret (-1)
- Sondheim's Old Friends (-11)
- The Great Gatsby (+5)
- Moulin Rouge! (-11)
- Gypsy (-3)
- Pirates! The Penzance Musical (-1)
- Six (+2)
- Hell’s Kitchen (-1)
- Harry Potter and the Cursed Child (+6)
- Stranger Things: The First Shadow (+3)
- Call Me, Izzy (-16)
- Floyd Collins (+5)
- Smash (-3)
- Chicago (-)
- The Last Five Years (-4)
- Boop! The Betty Boop Musical (+2)
- Dead Outlaw (-1)
- Real Women Have Curves (+1)r Things: The
SHOW CLOSING RECAP: June 8: Othello, Good Night and Good Luck; June 22: Smash, Floyd Collins; June 28: Glengarry Glen Ross; June 29: The Picture of Dorian Gray, Dead Outlaw, Stephen Sondheims’s Old Friends, Real Women Have Curves.
THE MONTH AHEAD: Awards season has concluded, determining the fates for many shows. Next month is the first of the summer tourist months, traditionally a time where we see long running shows post high grosses, and newer shows post lower grosses. But with so many new shows already having closed, it remains to be seen how things will shake out. Many shows are running ticket discounts for the fourth of July week, already a potentially troubling sign for things to come. But this has been the strongest start to a season in Broadway history, and there’s no reason to indicate why that would not continue.
NOTE: All figures in this post are based off of weeks ending June 1, June 8, June 15, and June 22.

.jpg?format=auto&width=365)