INDUSTRY: Social Insight Report - January 8th - SpongeBob and Farinelli Top Growth!


With most ticket sales, purchasing decisions, and fan experiences happening online, a Broadway show's digital presence is more important than ever. In this feature, each week I'll analyze our exclusive Broadway Social Media data, highlighting the top growing plays, musicals, and upcoming productions.
Check out our exclusive Broadway show data and growth tracking chart, presented in the same format as our weekly Broadway Grosses, here.
![]()
Total Growth
Measures the total percentage increase in likes and follows over Facebook, Twitter, and Instagram over the previous seven days.
The top growing current Broadway musicals were Spongebob (5.09%), Once On this Island (3.37%), The Band's Visit (2.81%), Dear Evan Hansen (1.10%) and Come From Away (0.91%).
The top growing current Broadway plays were Farinelli and the King (6.87%), Parisian Woman (6.73%), Latin History for Morons (3.63%), Meteor Shower (2.11%) and Play That Goes Wrong (1.30%).
The top growing upcoming Broadway productions were Angels in America (11.19%), My Fair Lady (5.00%), King Kong (3.89%), Mean Girls (2.96%) and Frozen (1.12%).
BWW Tweet of the Week
![]()
Likes
The top growing shows this week on Facebook were Hamilton (+1,917), Anastasia (+938), School of Rock (+862), Aladdin (+802) and The Lion King (+709).
The shows with the least growth were My Fair Lady (+19), Parisian Woman (+19), Escape to Margaritaville (+20), King Kong (+20) and Meteor Shower (+22).
Talking About
The Broadway shows which had the most growth being talked about on Facebook were Aladdin (+14,912), Hamilton (+5,614), Waitress (+3,628), Latin History for Morons (+2,275) and Mean Girls (+1,461).
The Broadway shows which are down most being talked about on Facebook were Wicked (-10,258), Dear Evan Hansen (-3,811), Anastasia (-3,065), The Phantom of the Opera (-1,680) and Play That Goes Wrong (-636).
Check Ins Growth
The Broadway shows up in check ins for last week were Hello, Dolly! (+1,073), Spongebob (+1,072), Miss Saigon (+964), Waitress (+963) and Wicked (+940).
![]()
The top growing shows this week on Twitter were Hamilton (+2,511), Dear Evan Hansen (+800), Spongebob (+305), Waitress (+194) and Wicked (+193).
The shows with the least growth were Book of Mormon (-51), Beautiful (-3), Kinky Boots (+6), Escape to Margaritaville (+11) and King Kong (+11).
![]()
The top growing shows this week on Instagram were Hamilton (+5,223), Dear Evan Hansen (+4,126), Spongebob (+2,614), Mean Girls (+2,178) and Wicked (+1,522).
The shows with the least growth were Kinky Boots (-128), Farinelli and the King (+6), The Children (+12), Escape to Margaritaville (+15) and Bronx Tale (+19).
![]()
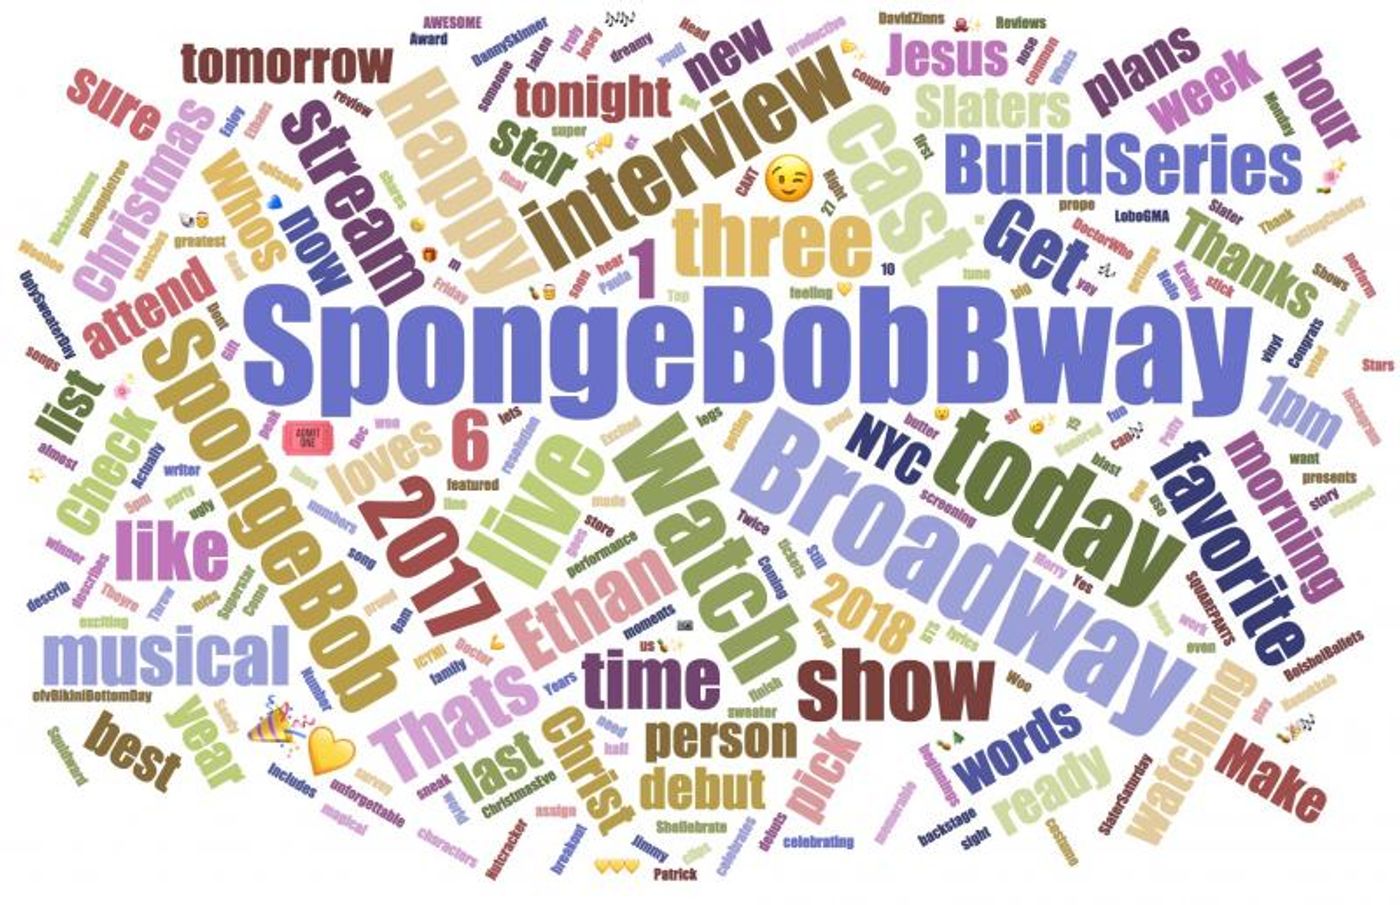
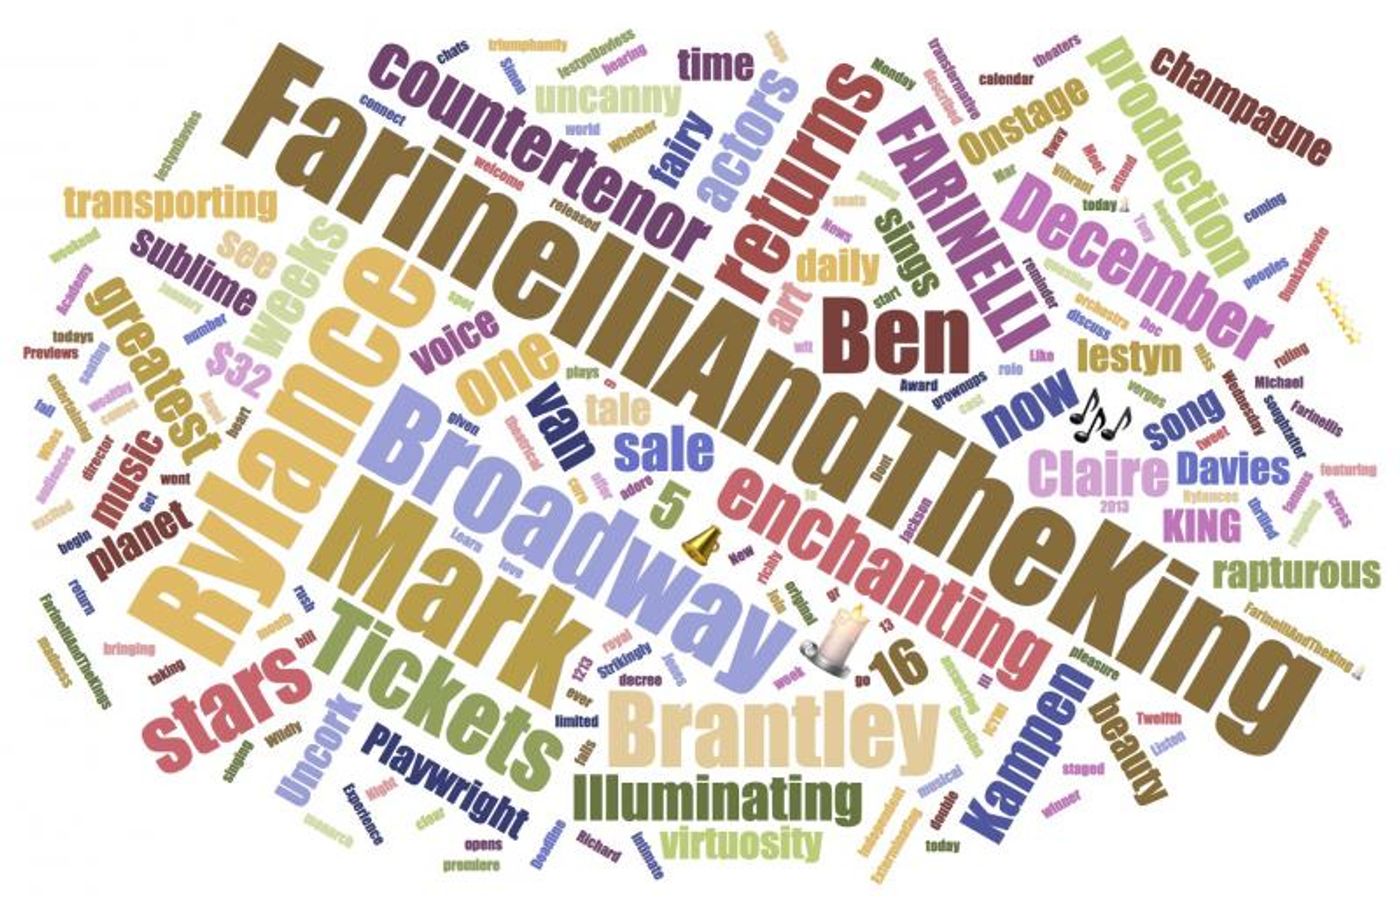
In this section each week we'll visualize the last 50 tweets from the top growing play and musical, with more frequently repeated terms being largest and least used terms being smallest.
Top Musical - SpongeBob
Top Play - Farinelli and the King

.jpg?format=auto&width=365)