

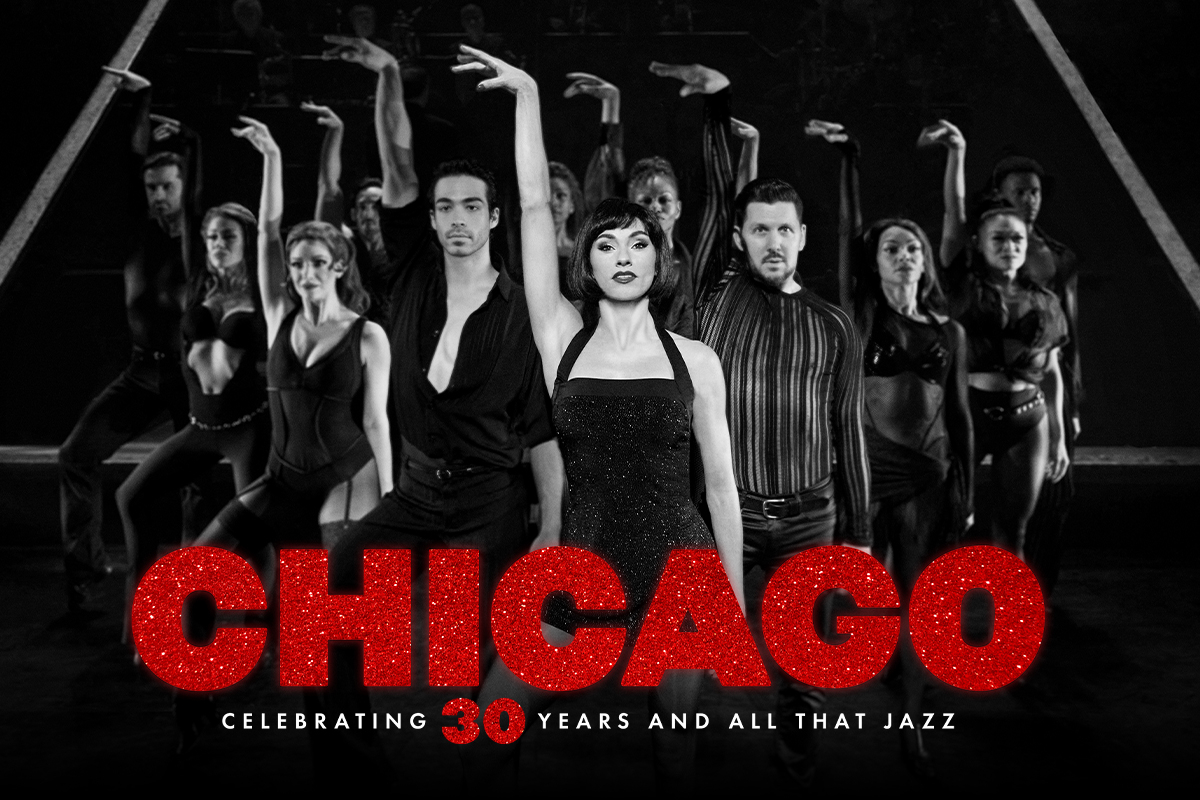
Chicago
Richard Rodgers Theatre (Broadway) · Musical · Currently Running
Season Pts
407
Avg/Week
17.7
Best Week
32
Worst Week
4
Weeks
23
Drafted By
59 players
Weekly Points
Detailed History
| Week | Gross | Cap% | WoW | Base | Cap | Surge | Slide | $1M+ | Total |
|---|---|---|---|---|---|---|---|---|---|
| Nov 1, 2026 | $787,225 | 80.0% | -22.6% | 15 | +1 | — | -4 | — | 12 |
| Oct 25, 2026 | $1,016,483 | 99.0% | -13.2% | 20 | +5 | — | — | +3 | 28 |
| Oct 18, 2026 | $1,171,488 | 101.0% | +0.7% | 23 | +5 | — | — | +3 | 31 |
| Oct 11, 2026 | $1,163,661 | 101.0% | +12.9% | 23 | +5 | — | — | +3 | 31 |
| Oct 4, 2026 | $1,030,366 | 98.0% | +5.1% | 20 | +5 | — | — | +3 | 28 |
| Sep 27, 2026 | $980,278 | 95.0% | -1.6% | 19 | +5 | — | — | — | 24 |
| Sep 20, 2026 | $995,932 | 101.0% | -0.1% | 19 | +5 | — | — | — | 24 |
| Sep 13, 2026 | $997,133 | 100.0% | +22.8% | 19 | +5 | +8 | — | — | 32 |
| Sep 6, 2026 | $812,251 | 88.0% | +16.3% | 16 | +3 | +8 | — | — | 27 |
| Aug 30, 2026 | $698,609 | 79.0% | +7.3% | 13 | +1 | — | — | — | 14 |
| Aug 23, 2026 | $650,965 | 75.0% | -9.1% | 13 | +1 | — | — | — | 14 |
| Aug 16, 2026 | $715,839 | 77.0% | -3.6% | 14 | +1 | — | — | — | 15 |
| Aug 9, 2026 | $742,764 | 78.0% | +2.0% | 14 | +1 | — | — | — | 15 |
| Aug 2, 2026 | $728,471 | 78.0% | -4.1% | 14 | +1 | — | — | — | 15 |
| Jul 26, 2026 | $759,355 | 81.0% | +30.6% | 15 | +1 | +8 | — | — | 24 |
| Jul 19, 2026 | $581,288 | 66.0% | -4.8% | 11 | — | — | — | — | 11 |
| Jul 12, 2026 | $610,679 | 72.0% | +42.5% | 12 | — | +8 | — | — | 20 |
| Jul 5, 2026 | $428,470 | 52.0% | -18.1% | 8 | — | — | -4 | — | 4 |
| Jun 28, 2026 | $523,440 | 61.0% | +11.2% | 10 | — | — | — | — | 10 |
| Jun 21, 2026 | $470,865 | 54.0% | +7.4% | 9 | — | — | — | — | 9 |
| Jun 14, 2026 | $438,376 | 51.0% | -2.0% | 8 | — | — | — | — | 8 |
| Jun 7, 2026 | $447,187 | 54.0% | -20.3% | 8 | — | — | -4 | — | 4 |
| May 31, 2026 | $561,404 | 64.0% | -17.4% | 11 | — | — | -4 | — | 7 |



Tickets From $59

Tickets From $60

Tickets From $80

Tickets From $58
